The challenge
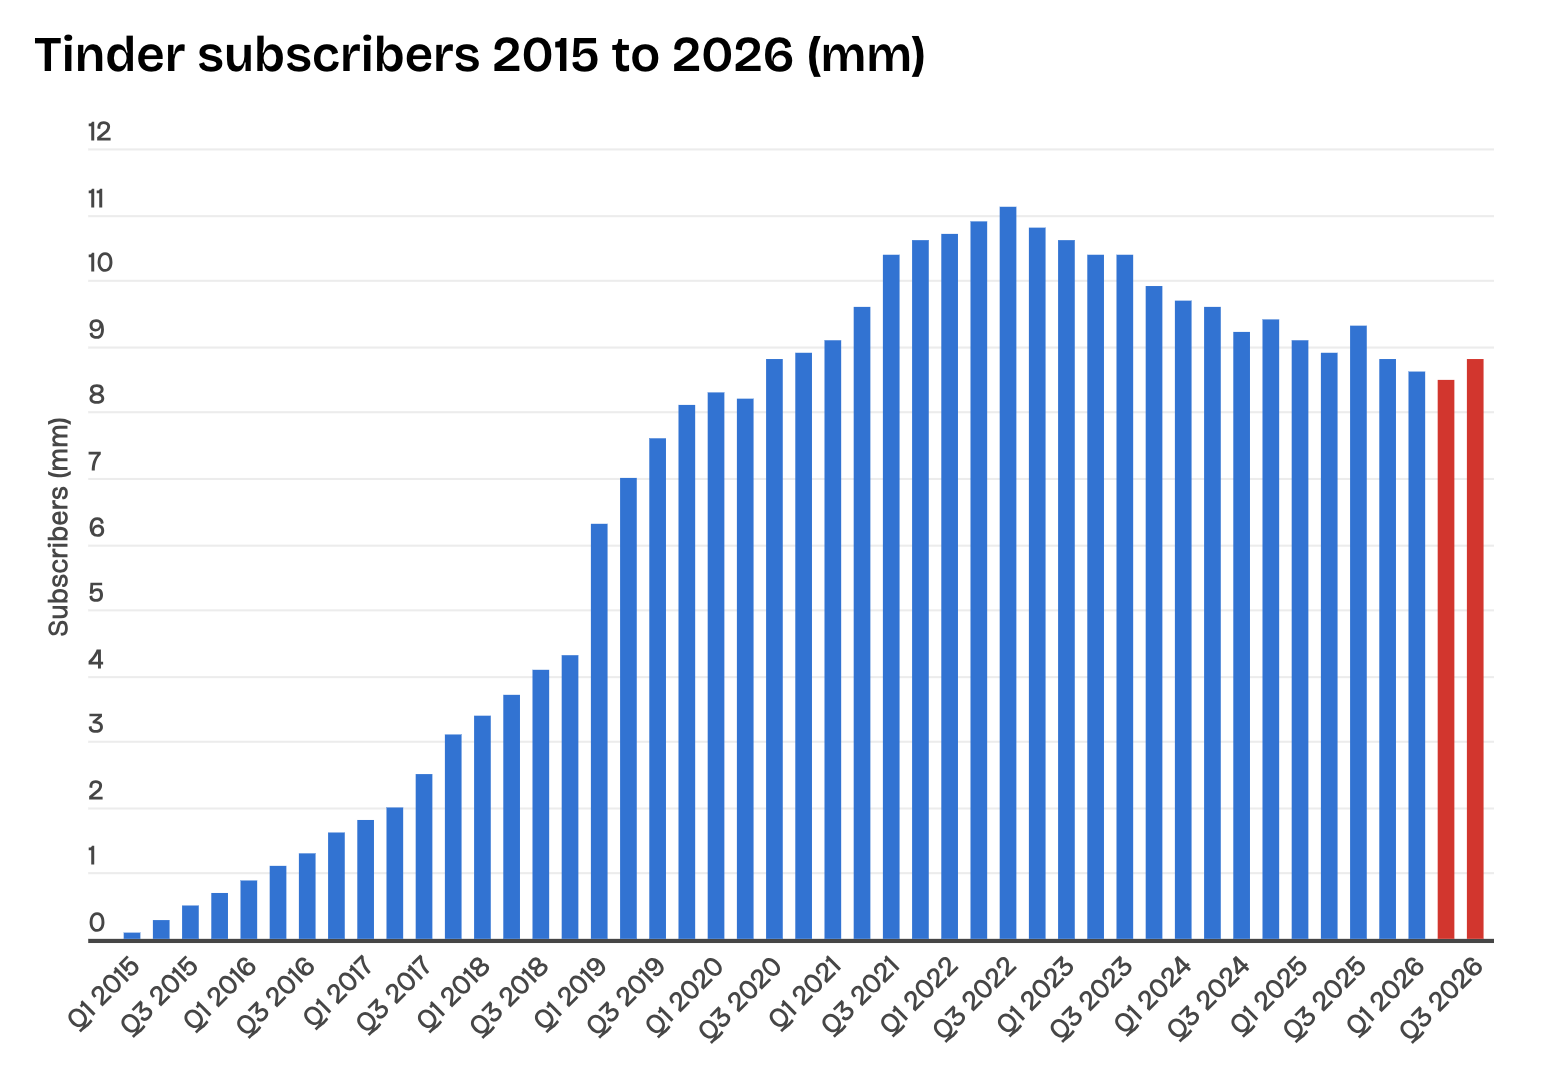
Tinder, one of the world’s largest dating apps, was facing a business downturn. We wanted to understand what made paid features valuable to subscribers and what free users needed to see before they would upgrade.
My contribution
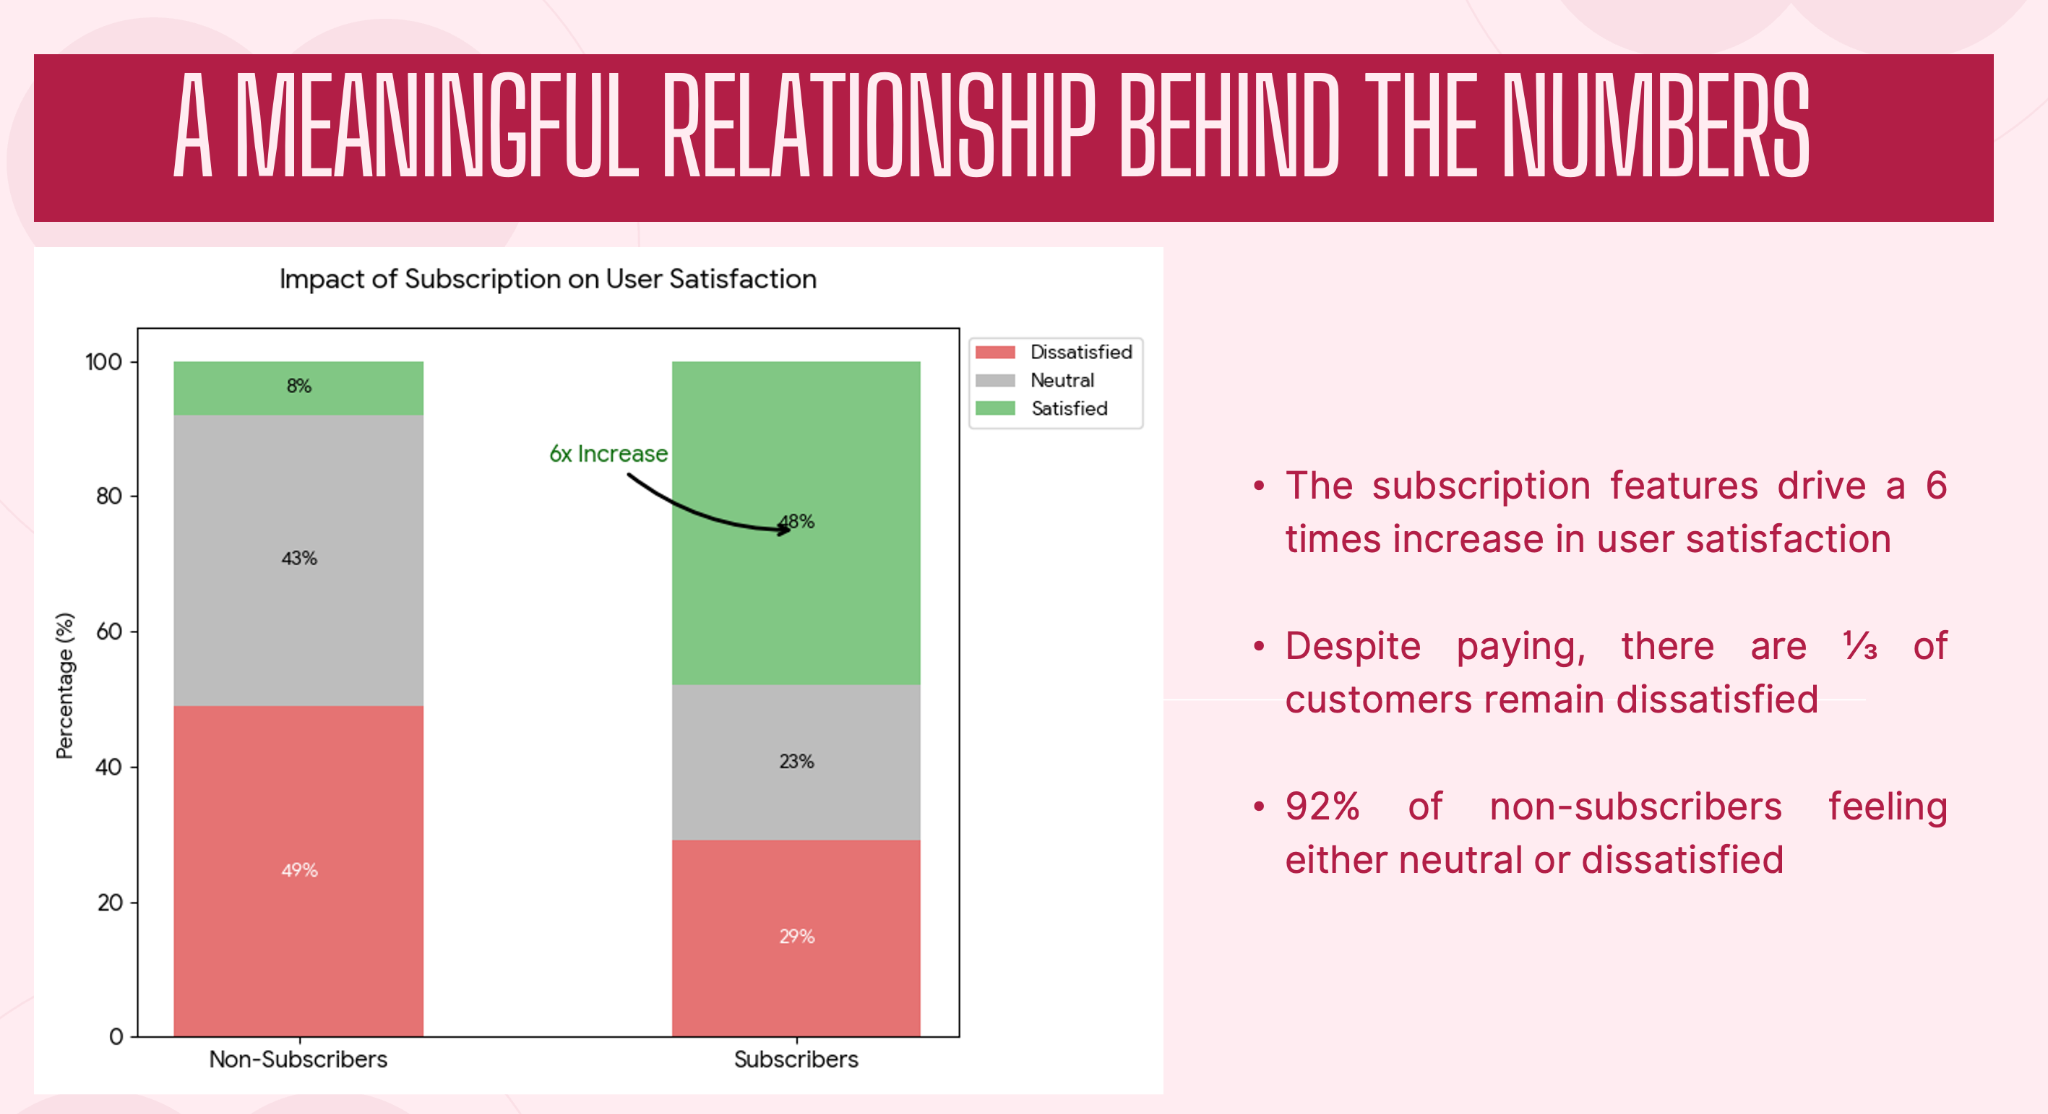
I designed the survey, used crosstabs and statistical tests in Radiant to examine how subscription status related to satisfaction and feature preferences, and visualized the findings in Tableau.
The process
We gave subscribers and free users separate sets of questions. 88% of subscribers surveyed said See Who Likes You was worth paying for. Among free users, doubts about whether paying would improve their experience ranked ahead of price as a barrier. Conversations we tracked in Brandwatch echoed that concern, with users asking whether paid features led to more likes or matches.
The output
- Prioritize paid features that help users act on existing interest.
- Show the benefits before purchase through previews or limited trials.
- Test flexible payment options such as short passes or single-feature purchases.
The takeaway
I learned to design surveys with the analysis in mind. Deciding upfront which groups to compare and how to structure response options made it easier to run statistical tests in Radiant and communicate the results in Tableau.